




Cross-Platform Campaign Measurement: How to Track Success
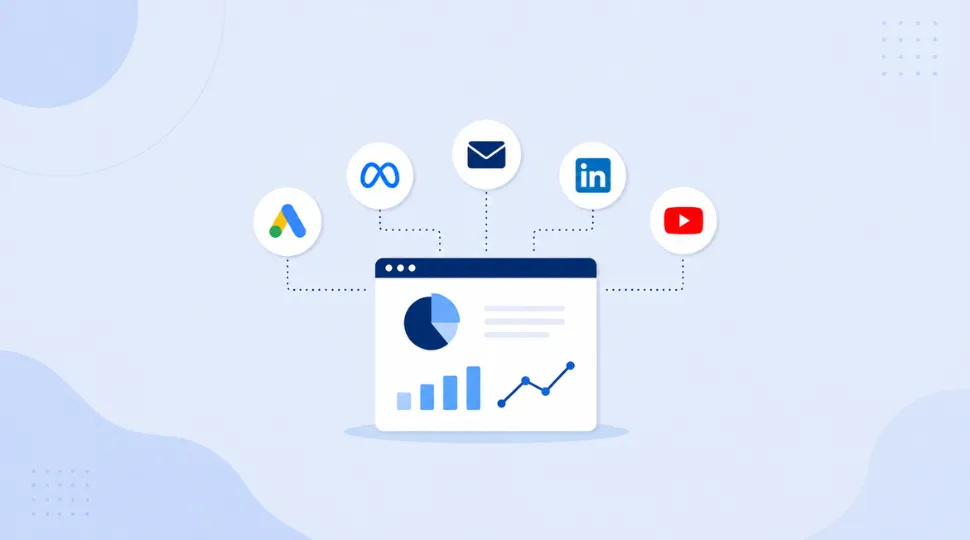
Cross-platform campaign measurement evaluates how marketing activities work together across Google Ads, Meta Ads, LinkedIn, YouTube, email, organic search and other channels. It connects media performance with website behaviour, lead quality, sales and revenue.
A customer may discover a brand on Instagram, search on Google later, read a blog and finally convert through a branded ad. Several platforms may claim influence, but the business received only one customer. A shared measurement system reduces this confusion.
To better understand the ideas discussed in cross-platform campaign measurement, consider strengthening your skills with a practical digital marketing course in Pune designed for real-world application.
What Cross-Platform Campaign Success Really Means
A campaign is not successful simply because it generated impressions, clicks or low-cost leads. It is successful when it creates a measurable business outcome at an acceptable cost.
That outcome could be revenue, qualified enquiries, app subscriptions, store visits, course admissions, repeat purchases or customer lifetime value.
Therefore, the first question should not be, "Which platform has the lowest cost per click?" It should be, "Which combination of platforms produces the most valuable customers?"
Google Analytics supports cross-channel conversion reporting across paid, organic, website and app activity. Its event-based structure measures interactions across websites and apps.
Platform reports still have value. Google Ads, Meta Ads and LinkedIn Campaign Manager show delivery, audience and creative performance within their respective systems.
However, these platforms should be treated as optimisation and diagnostic tools—not as the only financial source of truth.
Begin With Business Goals, Not Platform Metrics
Before launching a campaign, define one primary business objective and a small number of supporting objectives.
For example, an education business might use:
- Primary objective: Confirmed paid admissions
- Secondary objective: Qualified counselling calls
- Supporting objective: Cost per qualified lead
- Diagnostic metrics: Click-through rate, landing-page conversion rate and video completion rate
This hierarchy prevents vanity metrics from dominating the report. Reach and engagement can explain what happened, but they do not automatically prove profitability.
Use a Campaign Measurement Brief
Create a one-page measurement brief before spending begins. It should document:
- Campaign objective
- Target audience
- Platforms and campaign types
- Primary conversion
- Secondary conversions
- Revenue or lead-value assumptions
- Reporting period
- Attribution model
- Data owner
- Decision rules
Add a decision rule, such as increasing the budget only after a campaign stays below the target acquisition cost for two consecutive weeks.
This turns performance reports into decision-making tools rather than collections of disconnected numbers.
Build a Reliable Measurement Foundation
A polished dashboard cannot repair missing tags, duplicated conversions or incorrect CRM stages.
Define One Conversion Taxonomy
Use the same event names and meanings across your website, analytics account, advertising platforms and CRM.
A simple conversion taxonomy could include:
- generate_lead for a completed enquiry
- book_appointment for a scheduled consultation
- qualified_lead after sales verification
- purchase or enrolment after payment
- repeat_purchase for an existing customer
Do not treat button clicks as completed leads. Record conversions only after a successful server response, confirmation page or verified CRM entry.
For example, a user might click the Submit button, but the form may fail because of a technical error. Counting that click as a lead would inflate campaign results.
Connect Browser, Server and Offline Data
Browser-based tags remain useful, but measurement becomes stronger when first-party and offline data are connected.
Google explains that enhanced conversions supplement existing conversion tags using securely hashed first-party customer data. Meta's Conversions API creates a direct connection between business data and Meta's advertising systems, while LinkedIn supports website, Conversions API and CSV conversion sources.
For lead-generation campaigns, send qualified lead, opportunity and closed-sale stages back to the advertising platforms.
This helps campaign algorithms focus on business value instead of inexpensive but low-quality form submissions.
Test Tracking Before Launch
Use this pre-launch tracking checklist:
- Submit a test lead from every major landing page.
- Confirm that the event appears only once in analytics.
- Verify that the correct advertising platform receives the conversion.
- Check the source, medium and campaign values.
- Confirm that campaign identifiers are saved in the CRM.
- Test mobile, desktop and major browsers.
- Compare thank-you-page totals with backend records.
Document the test date, responsible person and final status. This creates accountability when discrepancies appear later.
Standardise Tracking Across Every Channel
Consistent campaign naming and UTM parameters are essential for reliable multi-platform campaign tracking.
Google's Campaign URL Builder guidance explains that UTM parameters help identify the campaigns that send traffic to a website.
A documented tracking structure may look like this:
utm_source=meta
utm_medium=paid_social
utm_campaign=performance_marketing_august
utm_content=video_testimonial_01
utm_term=business_owners
Keep campaign names lowercase and use one consistent separator. Avoid unclear labels such as:
- campaign1
- final-ad
- newcreative
- latest-campaign
- test123
Maintain a shared naming sheet for traffic sources, media types, objectives, locations, audiences and creative formats.
Keep auto-tagging enabled where supported. Use UTMs consistently for:
- Social media posts
- Email campaigns
- Influencer links
- QR codes
- Partner promotions
- WhatsApp campaigns
- Affiliate links
- Offline marketing materials
Without standardised naming, the same traffic source may appear under multiple labels, making channel comparisons unreliable.
Choose KPIs for Each Funnel Stage
Build a KPI ladder that moves from audience attention to business value.
Awareness KPIs
Use the following metrics when awareness is the campaign objective:
- Reach
- Frequency
- Video views
- Video completion rate
- Brand search activity
- Viewability
- Cost per thousand impressions
These metrics indicate whether the target audience was exposed to the campaign. They should not be presented as direct evidence of revenue.
Consideration KPIs
Consideration metrics may include:
- Engaged sessions
- Content views
- Email sign-ups
- Product-page visits
- Landing-page engagement
- Remarketing audience growth
- Brochure downloads
- Demo-page visits
These actions show that users moved beyond passive exposure and began exploring the offer.
Conversion KPIs
Conversion-focused campaigns should measure:
- Conversion rate
- Cost per lead
- Cost per qualified lead
- Cost per acquisition
- Revenue
- Return on ad spend
- Marketing efficiency ratio
Useful formulas include:
Conversion rate
Conversions ÷ Sessions × 100
Cost per acquisition
Campaign cost ÷ New customers
Return on ad spend
Attributed revenue ÷ Advertising spend
Marketing efficiency ratio
Total revenue ÷ Total marketing spend
Lead-to-sale rate
Customers ÷ Total leads × 100
Quality and Retention KPIs
Cheap leads can be misleading, especially for education, real estate, B2B services and other high-consideration products.
Add quality and retention metrics such as:
- Qualified lead rate
- Contact rate
- Opportunity rate
- Average order value
- Refund rate
- Repeat purchase rate
- Customer lifetime value
- Review ratings
- Customer review sentiment
Customer reviews and sales-call notes provide qualitative evidence. A channel producing fewer but better-fit customers may create value that last-click reports understate.
Understand Attribution Without Trusting It Blindly
Attribution assigns conversion credit to different touchpoints, but it is not proof of causality.
Last-Click Attribution
Last-click attribution gives all the conversion credit to the final interaction.
It is easy to understand but may undervalue discovery channels such as social media, video advertising, display campaigns and informational content.
Data-Driven Attribution
Data-driven attribution distributes credit based on observed conversion paths and contribution patterns.
Google describes data-driven attribution as a model that uses customer engagement with ads to determine how conversion credit should be assigned. GA4 also offers model-comparison reporting so marketers can examine how attribution models affect channel valuation.
Why Marketing Platforms Report Different Numbers
Google Ads, Meta Ads, LinkedIn and GA4 may report different conversion totals because they use different:
- Attribution windows
- Click and view definitions
- Identity-matching methods
- Time zones
- Consent signals
- Conversion dates
- Deduplication rules
Do not force every platform to report identical numbers. Instead, establish this reporting hierarchy:
- CRM or ecommerce backend: Confirmed revenue and customers
- GA4 or independent analytics: Cross-channel journeys and website activity
- Advertising platforms: Campaign optimisation and delivery diagnostics
As digital analytics expert Avinash Kaushik famously wrote:
"All data in aggregate is crap."
The lesson is to segment performance by audience, device, geography, creative, new versus returning visitors and customer quality rather than relying on one blended number.
Create a Unified Marketing Dashboard
A unified marketing dashboard should answer three questions:
- What happened?
- Why did it happen?
- What should we do next?
Include the following four reporting layers.
Executive Scorecard
The executive view should show:
- Total marketing spend
- Total revenue
- New customers
- Blended customer acquisition cost
- Overall ROAS
- Marketing efficiency ratio
- Performance against target
Keep this section simple. Senior decision-makers should be able to understand overall performance without studying campaign-level details.
Channel Comparison
Compare Google, Meta, LinkedIn, YouTube, email, organic search and referral channels using consistent business metrics.
Display platform-reported conversions separately from CRM-confirmed conversions. This prevents inflated totals and makes discrepancies visible.
Funnel Performance
Show the complete journey:
Impressions → Website Visits → Leads → Qualified Leads → Opportunities → Customers
A funnel view reveals where performance is leaking.
For example, strong traffic with weak lead volume may indicate a landing-page problem. High lead volume with few qualified opportunities may indicate poor targeting or weak form qualification.
Diagnostic Views
Break performance down by:
- Campaign
- Audience
- Creative
- Landing page
- Device
- Location
- Day
- Week
- New versus returning users
Add dashboard annotations for budget changes, new offers, website errors, holidays and tracking updates.
Never combine incompatible metrics without clear definitions. A view-through conversion and a CRM-confirmed sale are not interchangeable.
Measure Incrementality and Lead Quality
Attribution asks which touchpoint received conversion credit.
Incrementality asks whether the conversion would have happened without the marketing activity.
This distinction is especially important for branded search, remarketing and existing-customer campaigns. These campaigns may report strong ROAS because they reach users who are already close to purchasing.
Use controlled experiments where possible:
- Geographic holdout tests
- Audience holdout tests
- Platform lift studies
- Budget on-and-off tests
- Creative A/B tests
- Landing-page experiments
Document the hypothesis, test one major variable at a time and collect enough data before making a decision.
For lead-generation campaigns, connect the complete sales funnel.
A campaign with a ₹300 cost per lead may be worse than a campaign with a ₹600 cost per lead when only 2% of the cheaper leads qualify but 20% of the higher-cost leads become genuine opportunities.
Common Measurement Mistakes
Counting Every Platform Conversion as Unique
Adding Google, Meta and LinkedIn conversions together usually overstates campaign performance because the same customer may be credited by multiple platforms.
Optimising Only for Cheap Leads
A low cost per lead may hide poor contact rates, fake details, irrelevant enquiries or weak purchase intent.
Changing Attribution Settings Mid-Campaign
Changing attribution settings makes before-and-after comparisons unreliable. Document every change and restate historical data when possible.
Ignoring Tracking Errors
Sudden performance improvements can result from duplicated tags, broken consent settings or an event firing twice.
Investigate unusual increases before celebrating them.
Reporting Without Recommendations
Every campaign review should identify what to:
- Scale
- Pause
- Test
- Fix
- Investigate
A report containing numbers without decisions is incomplete.
Conclusion
Effective cross-platform campaign measurement requires shared business goals, consistent tracking, a clear reporting hierarchy and validation against sales or revenue data.
Use advertising-platform metrics to improve campaign delivery, analytics tools to understand customer journeys and backend systems to confirm commercial outcomes.
Strengthen the analysis with audience segmentation, customer feedback, sales data and controlled experiments. This approach transforms campaign reporting from a monthly presentation into a practical business decision-making system.
Whether you're exploring a digital marketing course in Thane or comparing digital marketing classes in Pune, choosing an affordable digital marketing course in PCMC can help you build strong fundamentals without overextending your budget.
FAQs
1. What is the best tool for cross-platform campaign measurement?
A practical setup combines GA4 for cross-channel behaviour, a CRM or ecommerce backend for confirmed outcomes, platform dashboards for optimisation and a unified reporting layer.
2. Why does GA4 show fewer conversions than advertising platforms?
GA4 and advertising platforms may use different attribution windows, identity signals, view-through rules and conversion dates. Compare their definitions before assuming that one system is incorrect.
3. Which attribution model should I use?
Use data-driven attribution when reliable data is available, but compare it with last-click attribution, backend sales and incrementality tests.
4. How frequently should campaign performance be reviewed?
Check delivery and tracking daily, optimisation metrics weekly and business outcomes monthly. Review customer cohorts and lifetime value for longer sales cycles.
5. Should paid and organic channels appear in the same dashboard?
Yes. Customers frequently move between paid, organic, email, direct and referral touchpoints. Showing them together provides a more realistic customer journey.
6. How can I measure phone calls and offline sales?
Use call tracking, campaign identifiers, CRM stages and offline conversion imports. Ensure that sales teams record lead sources consistently.
7. What should a small business measure first?
Start with:
- Marketing spend
- Leads
- Qualified leads
- Customers
- Revenue
- Customer acquisition cost
Add advanced attribution only after the basic tracking is accurate.
8. How can I improve campaign reporting accuracy?
Standardise UTMs, test events, remove duplicate conversions, connect CRM outcomes, align attribution windows and document tracking changes.